What 452 Small-Business Websites Show About UX and Measurement
By Ben Auffarth, Co-founder ·
Most small businesses have a website. Few can say what it does for them. We wanted a number for that, so we loaded the home pages of 452 independent small businesses (four local trades, drawn from an open places dataset) in the EU, the UK and Australia, and recorded which measurement tools each page ran.
This article keeps the parts that matter for UX and page design. The full study is a 14-page white paper from Chelsea AI Ventures, and the highlights are on their site.
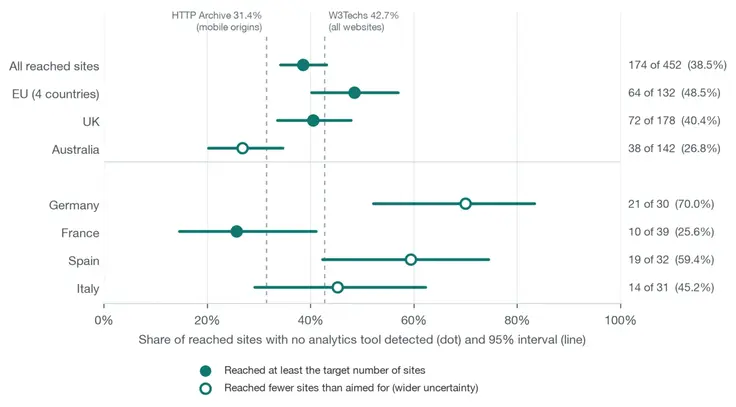
38.5% had no analytics tool we could detect
That is 174 of 452 sites (95% interval 34.1 to 43.1). By region: 48.5% in the EU sample, 40.4% in the UK and 26.8% in Australia. “None detected” means we found no tool in the page source or the network requests. A tool that loads only after a click, or runs on the server, is missed, so some of these sites may measure something we could not see.
The sample also covers only businesses that list a website. It says nothing about the ones without one.
For a design decision this matters because every UX change is a guess unless something counts what visitors do before and after it. A site without a count cannot tell a redesign that helped from one that did nothing.
You probably cannot A/B test, and that is fine
Testing two versions of a page needs more traffic than a small site has. Detecting a 10% relative lift on a 2% conversion rate takes about 161,000 visitors across both versions. At 1,000 visits a month that is 13.4 years. Even a 30% lift at a 3% baseline needs about 12,900 visitors in total.
The calculation uses the standard two-proportion formula at 95% confidence and 80% power. The white paper shows the arithmetic and a chart of months needed by traffic level.
What to do instead: fix the problems a person can see in a few minutes. A form that does not work on a phone, a missing price, an unclear offer and a slow first screen do not need a statistical test to justify a repair.
Forms are where the lead is lost
Three findings from the paper concern the form on your contact page:
- Length. Baymard Institute found that the average e-commerce checkout asks for 11.3 fields where most need 8, and that 17% of users had abandoned a checkout because it was too complicated. These are checkout results. We found no equivalent study for contact forms, so treat them as a direction.
- Labels. The WebAIM Million scan (February 2026, one million home pages) found that 33.1% of form inputs were not properly labelled. A field without a label is hard to use with a screen reader and harder to fix by touch on a small screen.
- Lost source. A form that sends name, email and message to an inbox, without the visit’s campaign parameters, cannot say where the lead came from. The business then optimises for ad-platform reports, which each claim credit for the same lead.
The first two are visible on the page. The third is invisible until somebody asks which channel pays.
Speed: fix the page that blocks an enquiry
Google’s Core Web Vitals set the thresholds: Largest Contentful Paint at 2.5 seconds or less, Interaction to Next Paint at 200 milliseconds or less and Cumulative Layout Shift at 0.1 or less. Only 134 of the 452 sites had Chrome field data at all, so for most small sites there is no public speed report to read.
The evidence that speed lifts sales is mixed. One controlled test exists: Vodafone split identical landing pages 50/50, and a 31% improvement in Largest Contentful Paint led to 8% more sales. Other widely quoted figures come from case studies without a described experiment. None of it tells you the size of the effect on a local service site.
Our reading: fix a slow page that stands between a visitor and an enquiry. Put a clearer offer, a working form and a visible price ahead of squeezing a score from 92 to 98.
What to do first
- Record where each enquiry came from. A spreadsheet with the lead’s source and, later, the value of the job is enough to start.
- Shorten the contact form to the fields you use, label each one, and add hidden fields for the campaign source.
- Add a privacy-friendly analytics tool so you have a baseline of visits, referrers and top pages.
- Reply to enquiries within the hour. A Harvard Business Review study of 1.25 million leads found that firms contacting a lead within an hour were nearly seven times as likely to qualify it as firms that waited an hour longer.
- Audit the page people land on, then fix what blocks the enquiry before polishing what does not.
The last step is what an audit from you x you i does: it reads a page for trust signals, clarity of message, speed and the path to an enquiry, and lists the problems in order.
Sources and limits
All figures above come from the white paper, which lists 44 sources and says which ones are vendor studies or unverified. Our own measurement is a single snapshot of 452 reached sites, with wide intervals for the country figures, because Germany, Spain and Italy each had fewer reached sites than the 35 we aimed for.